
I recently analyzed consumer data for a company (let’s call them company X) who was struggling to convert their traffic into customers – sound familiar? Company X had no issue bringing traffic to their website. In fact – their content was consistently ranked on the first page in Google. However once on the site, less than 0.5% of users were making a purchase.
To better understand the website’s user activity, I used Google Analytics to discover what would cause users to flood the site without making a purchase. Using three discovery questions, I used data from Google Analytics to guide me towards answers.
Am I Attracting the Right People?
The first step in answering this question is to find out who your website is attracting. This can be done using a variety of demographic parameters in Google Analytics including gender, age, location, and interests.
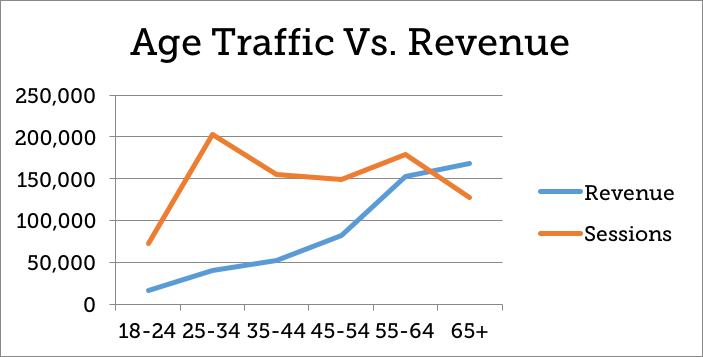
In the case of company X, the majority of their traffic (25%) was comprised of persons aged 24 – 35. Additionally, the users purchasing product were primarily aged 54 -65 (32%). However, persons aged 54 – 65 were only a small percentage (14%) of their traffic. Demographic data revealed there was a difference between those who were trafficking the website and those who were making a purchase.
Am I Attracting People for the Right Reasons?
After analyzing demographic data, I wanted to understand what was attracting both demographic groups to the website. Fortunately, Google Analytics has many tools that decipher user intention. In the case of Company X, I focused on landing page data and channel data. These metrics helped me understand how users were finding the site and on what landing page users were entering the website.
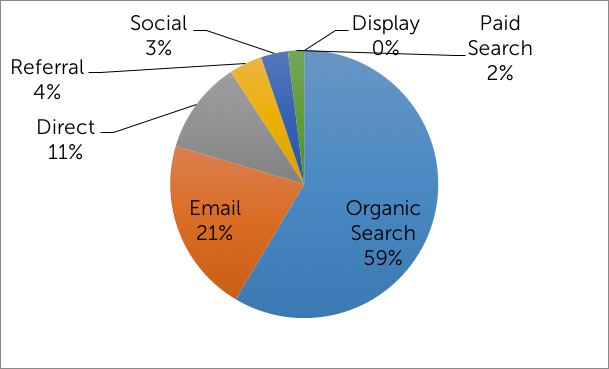
I discovered 59% of users aged 25 -34 were finding the site through organic search, entering the website through pages dedicated to content. In contrast, users aged 54 – 65 were directly accessing the site through product. Analytics revealed that not only did Company X have 2 distinct groups of users, but each demographic group accessed the website for different reasons.
Is My Website Optimized for My Users?
The final piece to my puzzle was understanding how each demographic group interacted once on the website. My focus turned to Google Analytics data such as device data, page views, and time on site. Interestingly, users aged 25-34 viewed 2 or less pages on the site and quickly exited the site after their initial interaction. These users also interacted with the site on a mobile device. In contrast, users 54 – 65, viewed more pages, spent more time on the site, and interacted with the site using a desktop device.
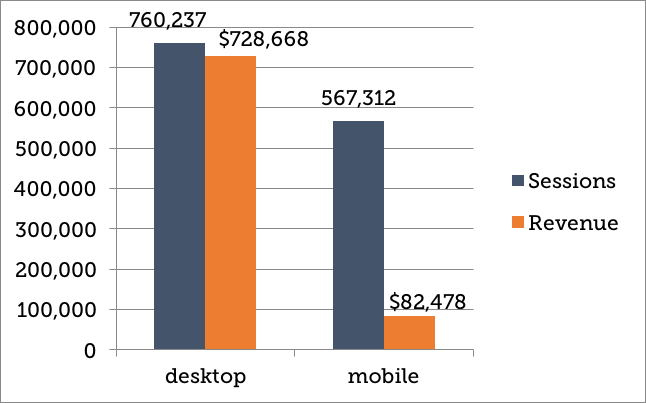
While there are many conclusions I could draw from these insights, my largest take-away directed my attention to Company X’s mobile experience. The extreme disparity between purchases made on desktop and purchase made on mobile indicated the mobile experience was not optimal for online purchase. Because the majority of traffic (users aged 25-34) used mobile devices to enter the site, it was critical to create a responsive experience that encouraged Millennial users to convert.
Before you design your next website strategy, I recommend digging deeper into Google Analytics to gain insights on both onsite behavior and user experience. You will be able to make more informed decisions on how to improve your website and create an optimized experience that will convert your traffic into customers.
For More Information, Contact Groove Today!