Ever wonder how your Shopify store is doing against the competition? We wanted the same question answered for our clients.
Through our 15+ years in business, we have seen first hand that our client base wanted to see how they compared to their competition. For this exact reason, we worked with Databox to create public Shopify Benchmark groups. By comparing your core metrics against others using the same eCommerce platform, data-driven strategies can be created to catch up to the competition.
Join The Shopify Benchmark Group
How Do I Join The Shopify Performance eCommerce Benchmark Group?
Joining the Shopify Performance Data Benchmarking Group is a straightforward process that opens the door to a wealth of actionable insights and data-driven decision-making. To become part of this exclusive community, simply follow the link provided below.
The following page will guide you through a simple sign-up procedure where you can input your details and gain immediate access to the group. Once you’re in, you'll be able to start comparing your metrics, gain valuable insights, and begin the journey of enhancing your eCommerce business with the support of robust, real-time data.
Join The Shopify Benchmark Group
What Is a Benchmark Group?
A benchmark group, particularly in the context of Shopify Performance Data, is a collective of eCommerce businesses that anonymously share and compare key performance metrics to gauge their relative standing in the industry.
This anonymous environment provides real-time insights into the success of your Shopify store by pooling data across a diverse array of Shopify stores. By joining a Shopify Performance Data Benchmarking Group, eCommerce merchants gain access to a wealth of comparative data, enabling them to identify strengths, uncover areas for improvement, and strategize on actionable steps to enhance their online store's performance.
This peer-driven approach to data sharing fosters continuous improvement, making it an invaluable resource for any eCommerce business looking to thrive.
What Shopify Performance Metrics Do You Compare?
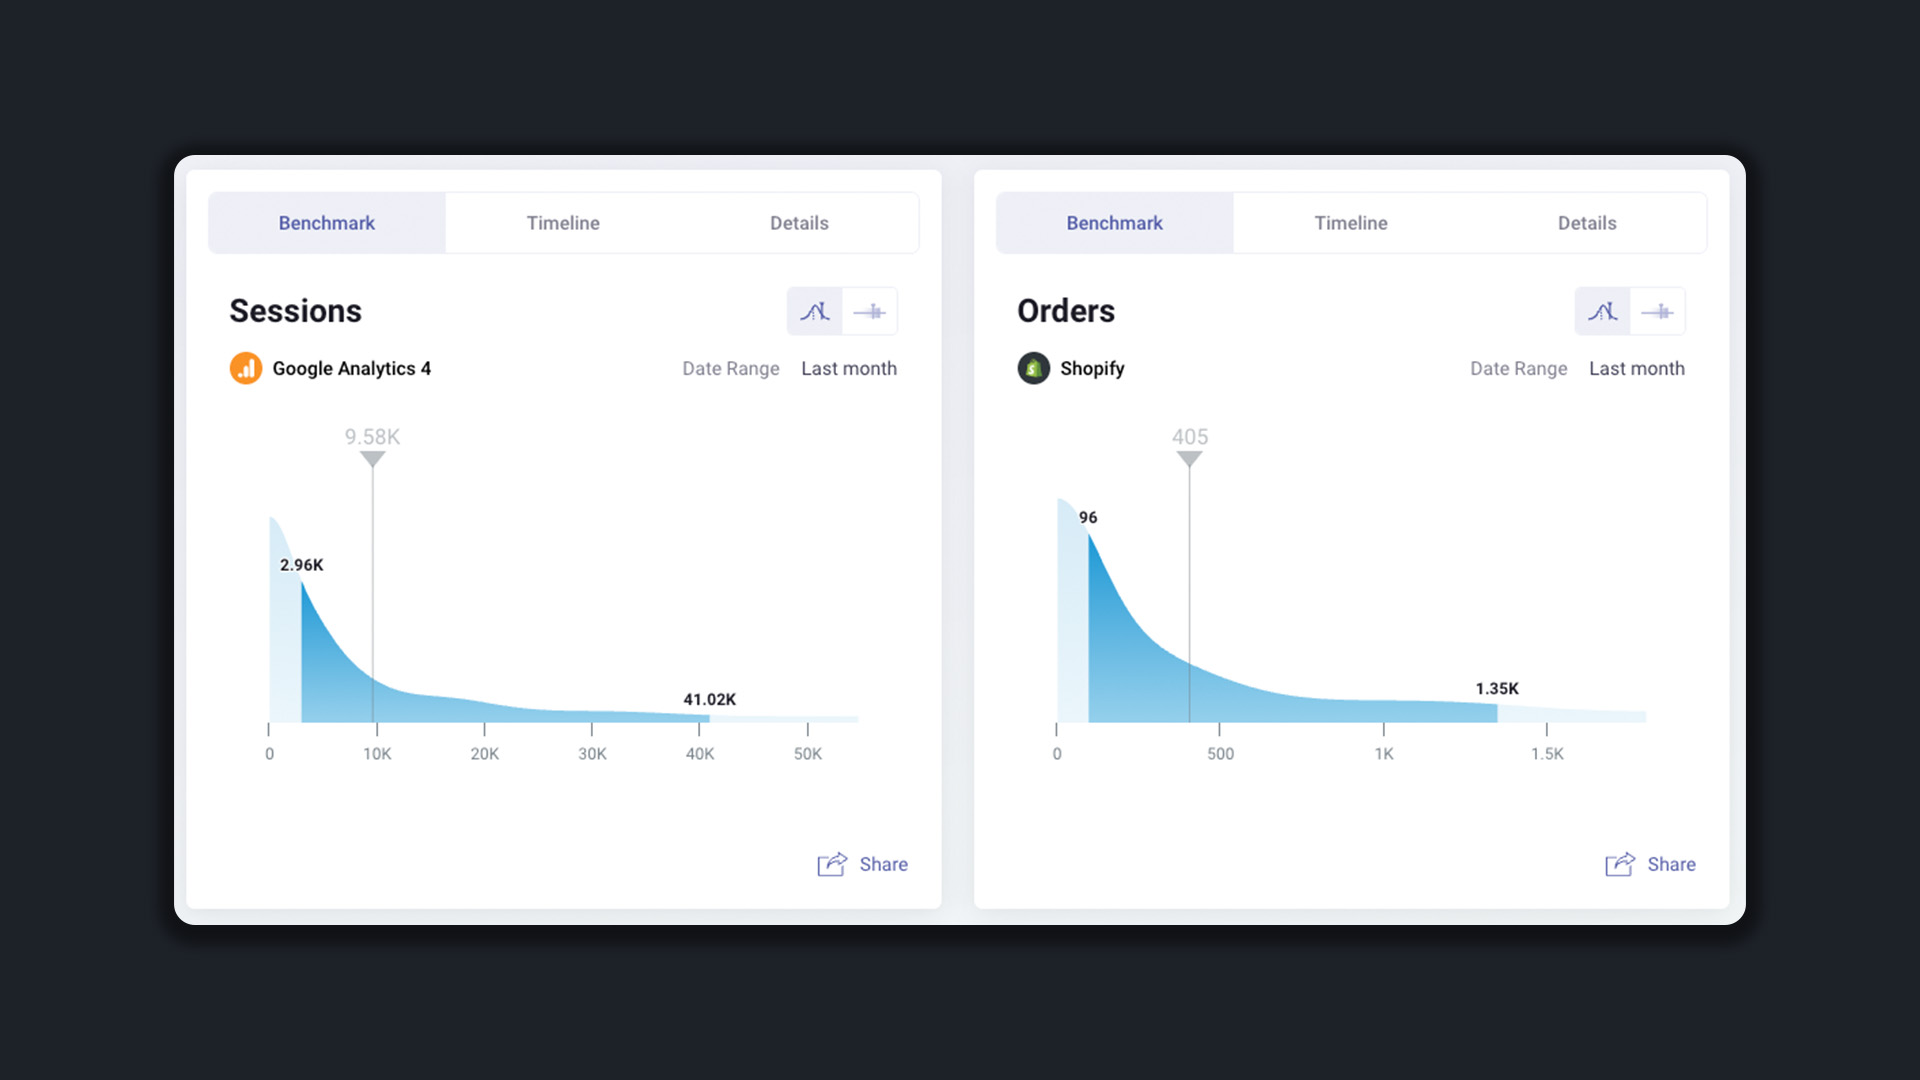
Certain metrics stand out for their direct impact on a store's financial health and operational efficiency. Within our Shopify Performance Data Benchmarking Group, we prioritize five core metrics that serve as the foundation of our evaluative process: sessions, orders, net sales, conversion rate, and average order value.
These metrics are pivotal because they offer a comprehensive view of a store's performance, from attracting visitors to closing sales.
Sessions track the total number of visits to your site, reflecting your ability to draw potential customers.
Orders measure the total transactions completed, indicating the effectiveness of your conversion strategies.
Net sales provide insight into the revenue generated, accounting for discounts and returns, showcasing the overall financial success.
Conversion rate reveals the percentage of sessions that result in a purchase, a key indicator of how well your store converts traffic into sales.
Lastly, the average order value (AOV) assesses the average dollar amount spent each time a customer places an order, highlighting opportunities to increase the value each visitor brings to your business.
By focusing on these core metrics, you are empowered with the knowledge to refine your strategies, enhance your operations, and ultimately, achieve greater success the as a Shopify store.
How Should I Read The Shopify Performance Data?
When approaching the data provided in the Shopify Performance Data Benchmarking Group, it's vital to have a methodical approach to interpret the metrics effectively. When reading the information below, pay attention to how each metric logically affects the following metric, ultimately resulting in Net Sales.
Here's how you should read the data for each core metric:
- Sessions
Look at the flow and distribution of sessions over the selected timeframe. A high number of sessions can indicate effective outreach and marketing, but when paired with other metrics, it can also provide insights into user engagement and the quality of traffic. Having high sessions with a low conversion rate means you are attracting traffic, but ultimately are not closing the deal.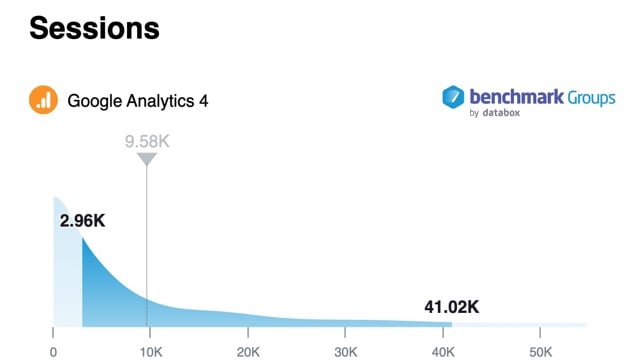
- Conversion Rate:
This is a key indicator of your store's performance in turning visitors into buyers. A lower conversion rate could suggest a need for improvement in website user experience, call-to-action messaging, the quality of your traffic, or checkout process optimization. Pairing sessions with conversion rate allows you to calculate how many orders will be placed on your site.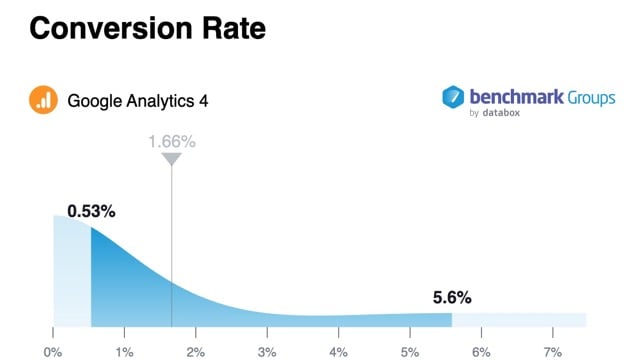
- Orders:
Examine the orders graph to understand sales volume. The relationship between sessions and orders can reveal your store's ability to convert visits into purchases, an essential aspect of your sales funnel efficiency.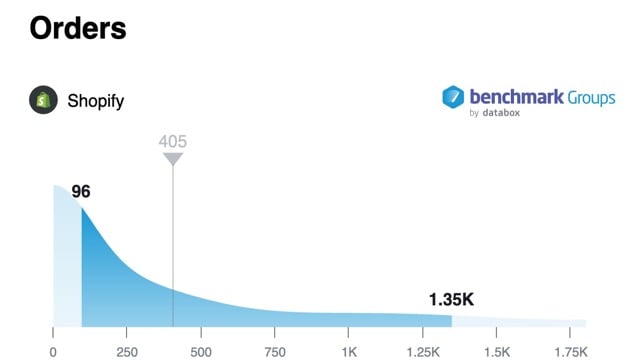
- Average Order Value (AOV):
AOV helps you understand how much your customers spend on average per order. Analyzing this in conjunction with orders can offer strategic insights into whether to focus on up-selling, cross-selling, or driving more traffic to your site.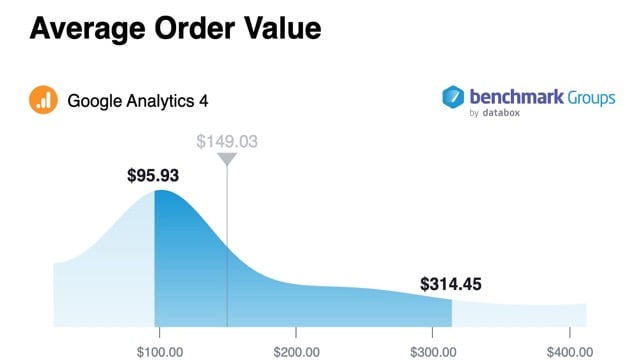
- Net Sales:
Net sales figures are crucial as they represent the actual revenue after returns, discounts, and other deductions. Evaluating this against sessions and orders can indicate your pricing strategy's effectiveness and your products' market fit.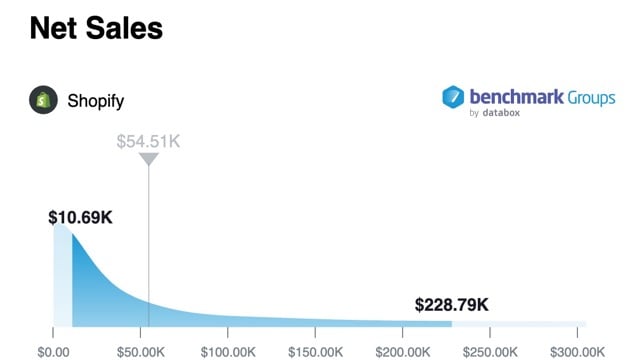
Each metric on its own tells a part of your store's performance story, but together, they provide a comprehensive picture of your business's health. Look for trends, anomalies, and correlations between these metrics to gain a deeper understanding of your performance and where you can apply strategic changes for improvement.
Join The Shopify Benchmark Group
What Should I Do With The Shopify Performance Data?
Analyzing the data from the Shopify Performance Data Benchmarking Group provides actionable insights into where and how to enhance your eCommerce strategy. Below are examples of what you can do if you identify areas within each metric that could be improved:
1. Sessions:
If your sessions are low, it's a signal to amplify your online visibility. Invest in SEO to improve organic search rankings, engage in social media marketing to broaden your reach, and consider pay-per-click (PPC) campaigns to drive targeted traffic to your store.
2. Conversion Rate:
Should your conversion rate need a boost, focus on optimizing the checkout process to remove friction. Simplify forms, provide multiple payment options, and ensure your site’s loading speed is fast. A/B testing different elements on your site can also lead to valuable insights for improvement.
3. Orders:
A lower-than-desired order count calls for a review of your customer acquisition and retention strategies. Optimize your product listing and checkout pages for conversions, create compelling calls-to-action, and implement retargeting ads to bring back visitors who didn’t make a purchase.
4. Average Order Value (AOV):
To improve AOV, implement strategies like upselling higher-end alternatives or cross-selling related products at the point of purchase. Personalized product recommendations and time-sensitive offers can also encourage customers to increase the size of their orders.
5. Net Sales:
If net sales are not up to par, you might need to refine your product offerings or pricing strategies. Consider testing different price points, offering bundled deals, or enhancing your product line with items that have a higher perceived value to increase overall sales revenue.
Utilize this data to inform your decision-making process, develop targeted strategies to address specific weaknesses, and track the success of your initiatives over time to ensure continuous improvement in your store's performance.